install.packages("tmaptools")Code Sample
About this Code Sample
Quarto is an amazing tool and I love it, but I view it primarily as a tool for presentation and visualization and haven’t used it much for data pipelines in production. Most of my work over the last three years has been in a data engineering and DevOps role supporting other epidemiologists who build visualizations. Consequently, I have relatively few recent quarto code samples in my portfolio.
Here’s a simple quarto code sample that I adapted from something I worked on a few years ago. Because it’s not very recent, I’ve also included links to code samples from projects I’ve worked on more recently that didn’t use quarto.
Background
For many types of spatial analysis require precise point locations, however many public health datasets only provide an address which needs to be geocoded first to get a precise point.
It is important to maintain the privacy and security of public health data for legal and ethical reasons. Therefore, when geocoding we should avoid sending patient address, encrypted to 3rd party online servers whenever possible.
This document demonstrates how to setup an offline, open-source, and free geocoding database locally allowing epidemiologists to geocode using R securely behind their own firewalls. The geocoding procedure is also free and not subject to API rate limits.
Required software
- Windows
- Windows Subsystem for Linux (WSL) or Hyper-V
- Docker
- R
(If you’re running Linux, the process should be very similar but you can skip installing (WSL) or Hyper-V).
Demonstration of Online Geocoding
Open R or RStudio and install the
tmaptoolspackage by running the following code. You only need to installtmaptoolsonce.
- For example data, we’ll use the Rhode Island state capitol. This is a public demonstration, so instead of using an actual patient address, we’ll use the address of a public building. Run the following code in R:
# Start by loading the library
library(tmaptools)
# define the address
RI_state_capitol <- "82 Smith St, Providence, RI 02903"Then use the geocode_OSM() function from the tmaptools package to geocode the address we defined above.
# Including the namespace is redundant, but something I like to do...
# ...to make it clear which function comes from which package and avoid...
# ... namespace conflicts. The slight performance hit is usually worth...
#... the improved clarity
tmaptools::geocode_OSM(RI_state_capitol)$query
[1] "82 Smith St, Providence, RI 02903"
$coords
x y
-71.41496 41.83090
$bbox
xmin ymin xmax ymax
-71.41558 41.83064 -71.41434 41.83115 This works, yay! The problem is that the default behavior is to send the address to the online server. From the documentation we can see that the addresses are sent to the server at https://nominatim.openstreetmap.org. That means the addresses are being sent out into the public internet unencrypted and could potentially be intercepted or diverted.
Here are the function arguments and default parameters taken from the documentation:
geocode_OSM(
q,
projection = NULL,
return.first.only = TRUE,
keep.unfound = FALSE,
details = FALSE,
as.data.frame = NA,
as.sf = FALSE,
geometry = c("point", "bbox"),
server = "https://nominatim.openstreetmap.org"
)Demonstration of Offline Geocoding
Fortunately, there’s also the option to send the addresses to a local Nominatim server. Here’s the description of the server argument taken from the documentation
server OpenStreetMap Nominatim server name. Could also be a local OSM Nominatim serverSo, if we can setup a “a local OSM Nominatim server” we should be able to geocode without sending any address data over the internet. Open Street Maps allows people to download and setup an offline geocoding database. Nominatim documentation doesn’t have install instructions for windows, but there is an option to run a local OSM nominatim server in a docker container on windows. Here’s how:
Install Docker Desktop for Windows using these instructions. Make sure to also install WSL or Hyper-V. For this example I used WSL.
After docker desktop is installed and running, open a command prompt window and enter the following. (Depending on what you use for your RStudio terminal, you may also be able to enter the code in the terminal tab in the bottom left corner. I haven’t tested it, but PowerShell should also work. Linux requires sudo for Docker).
docker run -it --rm \
-e PBF_URL=https://download.geofabrik.de/north-america/us/rhode-island-latest.osm.pbf \
-e REPLICATION_URL=https://download.geofabrik.de/north-america/us-northeast-updates/ \
-p 8080:8080 \
--name nominatim mediagis/nominatim:4.0The command is taken from the following documentation and downloads the Nominatim image from docker and starts a container running off the image. The command I used is identical to the documentation except that I changed the two data source urls to only include data from Rhode Island. You will need to change these two URLS for the location which you wish to geocode:
PBF_URL=https://download.geofabrik.de/north-america/us/rhode-island-latest.osm.pbf
REPLICATION_URL=https://download.geofabrik.de/north-america/us-northeast-updateThe docker container is exposed on port 8080 using the following argument
-p 8080:8080The download and install process takes a bit of time and you should see quite a bit of text flash across your terminal. If at the end you see the following, everything installed correctly and the geocoding database is ready to use:
database system is ready to accept connectionsReturn to R and rerun the geocoding command after changing the server argument in geocode_OSM() to server = "http://localhost:8080/" which corresponds to the local port I chose for the Nominatim docker container. To verify that the process is truly offline, disconnect from the internet and test the offline geocoding process with a few addresses
# Rhode Island State Capital
tmaptools::geocode_OSM(RI_state_capitol, server = "http://localhost:8080/")$query
[1] "82 Smith St, Providence, RI 02903"
$coords
x y
-71.41496 41.83090
$bbox
xmin ymin xmax ymax
-71.41558 41.83064 -71.41434 41.83115 #Newport Tennis Museum
tmaptools::geocode_OSM("194 Bellevue Ave, Newport, RI 02840",
server = "http://localhost:8080/")$query
[1] "194 Bellevue Ave, Newport, RI 02840"
$coords
x y
-71.30648 41.48244
$bbox
xmin ymin xmax ymax
-71.30657 41.48216 -71.30599 41.48276 #Massachusetts State Capital
tmaptools::geocode_OSM("24 Beacon St, Boston, MA 02133",
server = "http://localhost:8080/") No results found for “24 Beacon St, Boston, MA 02133”. NULL
It works! We can geocode offline for addresses in Rhode Island. The failure to geocode the address in Massachusets is expected behavior because we only included Rhode Island data when we fetched the docker image and started the container.
Batch Geocoding
Multiple addresses can also be geocoded in batches. Let’s try geocoding the three addresses from above all at once.
lots_of_addresses <- c(RI_state_capitol,
"194 Bellevue Ave, Newport, RI 02840",
"24 Beacon St, Boston, MA 02133")
lots_of_points <- tmaptools::geocode_OSM(lots_of_addresses,
server = "http://localhost:8080/")Here’s a table showing the results from the batch geocoding. If we were working with actual patient data we could easily join these results back to a the original dataframe that the patient addresses came from.
DT::datatable(lots_of_points,
options = list(pageLength = 3,
scrollX = TRUE),
class = "my-table")Create maps
The geocoded points can be used for further spatial analysis or to create maps and other visualizations. Here’s a very simple example of mapping. We’ll start by creating a map of Rhode Island.
#|echo: false
# If these libraries aren't already installed you need to run install.packages(c("sf", "tmap"))
# Linux only: sf and tmap have external dependencies that you may need to install outside of R using your distro's package manager
library(tmap)
library(sf)Linking to GEOS 3.12.1, GDAL 3.8.4, PROJ 9.4.0; sf_use_s2() is TRUE## tmap mode set to interactive viewing
tmap_mode("view")ℹ tmap mode set to "view".#here's a map of Rhode Island
# the shapefile comes from this website: https://www.rigis.org/datasets/edc::state-boundary-1997/about
ri <- st_read("https://services2.arcgis.com/S8zZg9pg23JUEexQ/arcgis/rest/services/BND_State_1997_spf/FeatureServer/0/query?outFields=*&where=1%3D1&f=geojson")Reading layer `OGRGeoJSON' from data source
`https://services2.arcgis.com/S8zZg9pg23JUEexQ/arcgis/rest/services/BND_State_1997_spf/FeatureServer/0/query?outFields=*&where=1%3D1&f=geojson'
using driver `GeoJSON'
Simple feature collection with 354 features and 4 fields
Geometry type: POLYGON
Dimension: XY
Bounding box: xmin: -71.89239 ymin: 41.14656 xmax: -71.12052 ymax: 42.01888
Geodetic CRS: WGS 84# Create a map of Rhode Island
tm_shape(ri)+
tm_polygons(fill = "green", fill_alpha = 0.2) +
tm_layout(frame = FALSE,
outer.margins = c(0.1,0.1,0.1,0.1)) +
tm_title("A light green map of Rhode Island")So that created a map with an outline of the state of Rhode Island. Now let’s add the geocoded points we created onto the map
# The first step is to create an sf object
# with the same crs as the shapefile of Rhode Island
geocoded_points_sf <- st_as_sf(lots_of_points,
# source of coordinates
coords = c("lon","lat"),
# retrieve crs from ri and use it for this sf object
crs= st_crs(ri))
# And now we add the points to the map of Rhode Island
# syntax is similar to ggplot2
tm_shape(ri)+
tm_polygons(fill = "green", fill_alpha = 0.2)+
tm_shape(geocoded_points_sf)+
tm_dots(fill = "red",
size = 1)+
tm_layout(frame = FALSE,
outer.margins = c(0.1,0.1,0.1,0.1)) +
tm_title("My favorite places in Rhode Island")We could also create a static map of the same thing
## tmap mode set to plotting
tmap_mode("plot")ℹ tmap mode set to "plot".tm_shape(ri)+
tm_borders()+
tm_shape(geocoded_points_sf)+
tm_dots(fill = "blue", size = 1)+
tm_layout(frame = FALSE,
inner.margins = c(0.1,0.1,0.1,0.1)) +
tm_title("My favorite places in Rhode Island") [plot mode] fit legend/component: Some legend items or map compoments do not
fit well, and are therefore rescaled.
ℹ Set the tmap option `component.autoscale = FALSE` to disable rescaling.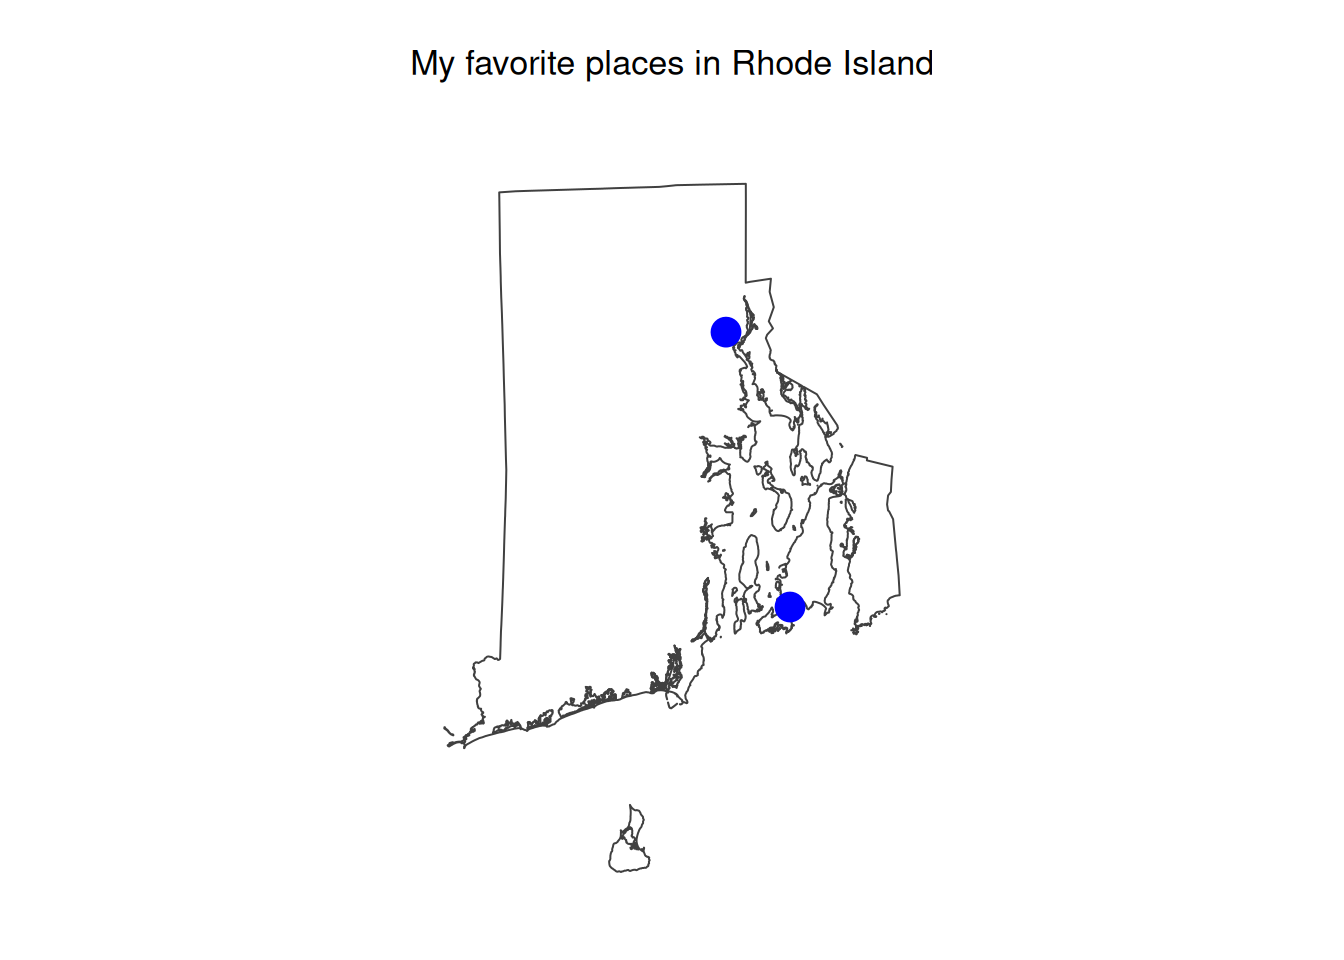
FAQ and Troubleshooting
Q: When I try to run the Docker container I get an error about self-signed certificates
A: This is likely an issue with your organization’s firewall. When I tried this on a work computer at a previous employer I occasionally got this error, but I’ve never seen it on a personal computer.
Q: What is Docker?
A: It is a tool for distributing software and managing dependencies, by creating isolated environments and processes into containers. Here’s a link to Docker’s documentation.
Q: Where can I find the code used to create this quarto file?
A: Here
The End!
Additional Code Samples
Here are links to a few other projects I’ve worked on that didn’t use quarto:
Shiny Dashboard
Here’s a link to an example shiny dashboard. I used a publicly available dataset of bigfoot sightings, but the same techniques could be used to visualize actual health data. The project shows examples of integrating custom CSS and custom Javascript into shiny dashboards as well as using GitHub Actions to automatically publish the dashboard every time there’s a commit to the main branch.The project unfortunately does not use shiny modules, however I have started to use them in a different (incomplete) shiny dashboard
Python Package
I realize that the role I’m applying for will use primarily R, but I still wanted to briefly highlight a project I’m working on that uses two other tools commonly used by epidemiologists: Power BI and Python. This python package is still a work in progress but it contains a set of python functions that allow users to create Power BI dashboards by running python code instead of opening Power BI desktop.The project shows examples of using GitHub actions to automatically update documentation and automatically publish to PyPI whenever there’s a new release.
Batch Scripts
Here’s a link to a batch script I wrote at the Washington State Department of Health to automatically create an R environment and run R data processing pipelines. The batch script was written so that we could share our R data processing pipelines with other teams and guarantee that they had the same software environment on their computer as we had on ours. Reproducible code requires reproducible environments!Here’s a link to a talk I gave about the batch scripts project.
This project was later adapted to a larger, (unfortunately non-public), project I worked on to standardize how we created and managed cloud resources across GitHub, Databricks, Azure, and Power BI Service. The technique, (without any code samples), is described in more detail here.
GitHub Repositories
There are other unfinished projects on my GitHub such as a bot built with R that posts maps of random cities to Bluesky and an R package to process .gpx files similar to how Strava does. The projects are not what I’d consider portfolio ready, but they’re public so feel free to browse :)